Monday, October 29, 2012

Isotachs


http://www.erh.noaa.gov/gsp/localdat/cases/2009/18-20DecemberWinterStorm/18-20DecemberWinterStorm.html

Isotachs are contour lines of equal wind speed. They are usually contoured in the upper levels of the  atmosphere especially at the jet stream level. This map indicates winds over Alabama in December.

Isobars


http://www.daviddarling.info/encyclopedia/I/isobar.html

Isobars connects points of equal pressure at the Earths surface or at a constant height above it. The atmospheric pressure is measured in millibars. The closer the isobars are, the stronger the winds will be and if the isobars are far apart, the winds will be lighter. Isobars are generally wrapped tightly around regions of low pressure (windy, wet and cloudy) but are apart around regions of high pressure (winds are light, breezy and calm). In areas of low pressure, wind flows counterclockwise, while in areas of high pressure, wind flows clockwise. Wind flows roughly parallel to the isobars. 

Mental Map


http://bendedbrains.com/worlds-size/

Mental maps are shorthand versions of the world that we live in that consists of assumptions and core beliefs, which represent the internal logic of our sensations, our perceptions and the interpretations we use to make meaning out of that information and of life events. Mental maps can be used to help us get around familiar places or they can represent events in our lives.

Wednesday, October 24, 2012

Climograph


http://met101.org/wiki/Climograph

This is a Climograph of the Twin Cities in Minnesota. It shows the climatic parameters between temperature and precipitation and their monthly average year round. Climographs usually show and overlapped combination of a bar and line chart. This type of representation shows that the range of temperature (average of min./max. temperatures) can be shown that just the average temperature. Precipitation is represented by the bar graph while the line graph represents temperature.

Wednesday, October 3, 2012

DLG Map


http://liveitloveitandbleedit.blogspot.com/2010/04/dlg.html

Digital Line Graphs (DLG) are digital vector data that represent cartographic information. They contain a wide variety of information depicting geographic features like boundaries, hypsography, hydrography, roads, utility lines. The U.S. Geological Survey (USGS) DLG data are classified as large, intermediate, and small scale.


Star Plots


http://www.datavis.ca/milestones/index.php?group=1950%2B

Star plots are used to examine the relative values for a single data point and to locate similar points or dissimilar points. The star plot consists of a sequence of equip-angular spokes, called radii, with each spoke representing one of the variables. Star plots can find out what variables are dominant for a given observation, what observations are most similar, and if there are outliers.

Monday, October 1, 2012

Cadastral Map

                             
                                   http://www.spaceage.co.in/cadastral-surveys.php

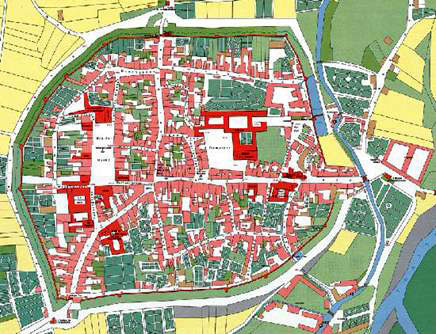
Cadastral Maps display the spatial descriptions of land-parcel boundaries that define the loaction, shape, and size of land parcels within the context of a regional or national geodetic positioning system. If they are maintained in a real-time manner, these maps can serve as a base for a reliable property rights system. Most parcel boundaries are defined by stable marks or visible features on the ground (artificial or natural).